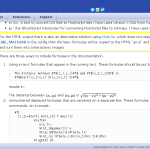
texinfoのマニュアルを読んでいて。
\(
\;\;\;\;\;\sin 2\pi \equiv \cos 3\pi
\)
ん?
ん? ん? ん? ん? ん? ん? ん? ん? ん? ん? ん? ん? ん? ん? ん?
 1 import numpy as np
 2 import matplotlib.pyplot as plt
 3 from matplotlib.ticker import EngFormatter
 4
 5 t = np.arange(2.0, 3.05, 0.05)
 6 s = np.sin(np.pi * t)
 7 c = np.cos(np.pi * t)
 8 fig, ax = plt.subplots()
 9 formatter = EngFormatter(unit='$\pi$', places=1)
10 ax.xaxis.set_major_formatter(formatter)
11 l1, l2 = ax.plot(t, s, t, c)
12 ax.grid(True)
13 fig.legend((l1, l2), ('sin', 'cos'))
14 plt.savefig("cs.png")
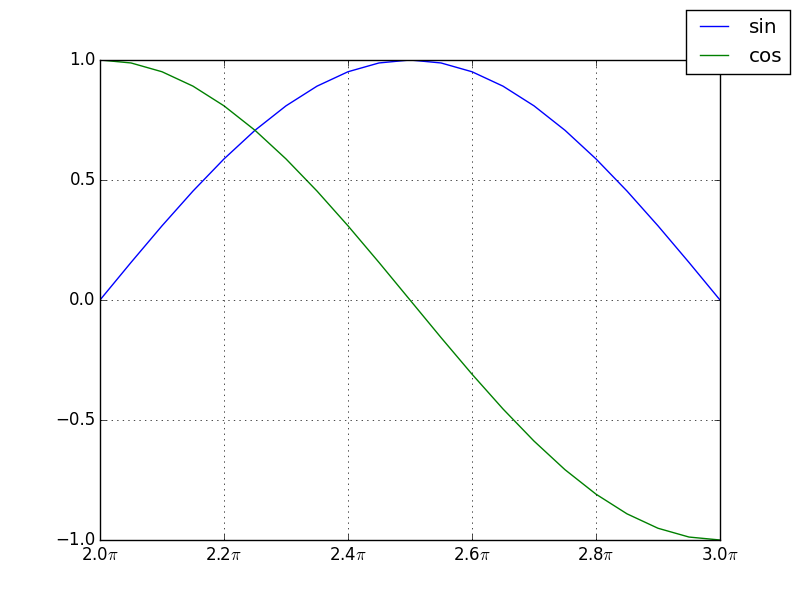
ん? ん? ん? ん? ん? ん? ん? ん? ん? ん? ん? ん? ん? ん? ん?ん? ん? ん? ん? ん? ん? ん? ん? ん? ん? ん? ん? ん? ん? ん?
どういう意味だこれ??


![[matplotlib] 続・「ヒストグラムの推移」を延々並べるわけにもいかんので](http://hhsprings.pinoko.jp/site-hhs/wp-content/uploads/2018/01/img_5a539d144c52f-150x150.png)
![[matplotlib] 「ヒストグラムの推移」を延々並べるわけにもいかんので](http://hhsprings.pinoko.jp/site-hhs/wp-content/uploads/2017/12/img_5a47b8edd586c-150x150.png)