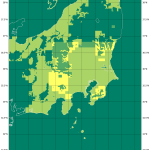
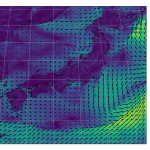
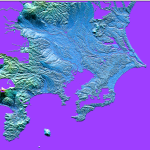
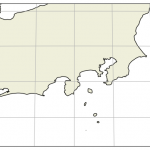
お遊びの上塗り。
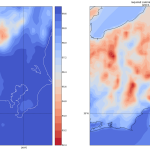
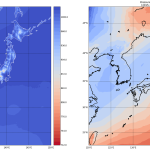
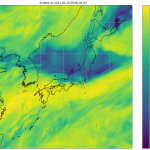
沸点がわかるとすれば、水が外気温と同じ水温と仮定して、この水温から沸点まで上げるのに必要なカロリーがわかる:
  1 # -*- coding: utf-8 -*-
  2 import sys
  3 import pygrib
  4 import numpy as np
  5
  6
  7 def _read(srcfn):
  8     # keys in Surfece:
  9     #    Pressure reduced to MSL
 10     #    Surface pressure
 11     #    10 metre U wind component
 12     #    10 metre V wind component
 13     #    Temperature
 14     #    Relative humidity
 15     #    Low cloud cover
 16     #    Medium cloud cover
 17     #    High cloud cover
 18     #    Total cloud cover
 19     #    Total precipitation
 20     #
 21     src = pygrib.open(srcfn)
 22     for s in src:
 23         yield (s.name, s.parameterName), s.validDate, s.latlons(), s.values
 24     src.close()
 25
 26
 27 data = {}
 28 for yk, vd, latlons, values in _read(sys.argv[1]):
 29     if "Pressure reduced to MSL" in yk and "Pressure reduced to MSL" not in data:
 30         data["Pressure reduced to MSL"] = latlons, values
 31     elif "Surface pressure" in yk and "Surface pressure" not in data:
 32         data["Surface pressure"] = latlons, values
 33     elif "Temperature" in yk and "Temperature" not in data:
 34         data["Temperature"] = latlons, values
 35     if len(data) == 3:
 36         break
 37
 38
 39 # -----------------------------------------------------
 40 #
 41 from mpl_toolkits.basemap import Basemap
 42 import matplotlib.pyplot as plt
 43 import matplotlib.cm as cm
 44 import matplotlib.ticker as ticker
 45
 46
 47 with plt.xkcd():  # I JUST TYPED import antigravity!
 48
 49     bmparams = dict(
 50         llcrnrlat=34.25,
 51         urcrnrlat=37.5,
 52         llcrnrlon=137.,
 53         urcrnrlon=140.825,
 54         resolution='i',
 55         projection='merc')
 56
 57     fig, axes = plt.subplots(1, 2)
 58     fig.set_size_inches(16.53 * 2, 11.69 * 2)
 59
 60     circles = np.arange(10, 90, 5)
 61     meridians = np.arange(-180, 180, 5)
 62     # -----------------------------------------------------
 63     # surface pressure as saturated vapour pressure
 64     latlons, e_s = data["Surface pressure"]
 65
 66     # inverse of Murray's equation
 67     ln_es = np.log(e_s / 100. / 6.1078)
 68     T_B = 273.15 + (-ln_es * 237.3) / (ln_es - 17.2693882)
 69
 70
 71     lons = latlons[1]
 72     lats = latlons[0]
 73     #
 74     X = latlons[1][0,:]
 75     Y = latlons[0][:,0]
 76     bmparams["ax"] = axes[0]
 77     m = Basemap(**bmparams)
 78     x, y = m(lons, lats)
 79     m.drawcoastlines(color='white', linewidth=1)
 80     m.drawparallels(circles, labels=[1, 0, 0, 0])
 81     m.drawmeridians(meridians, labels=[0, 0, 0, 1])
 82
 83     cs = m.contourf(
 84         x, y,
 85         T_B - 273.15,  # K to Celsius
 86         20,
 87         cmap=cm.coolwarm_r)
 88     m.colorbar(cs)
 89     axes[0].set_title("Boiling point of water\n[" + str(vd) + "]")
 90     # -----------------------------------------------------
 91     #
 92     # temperature
 93     latlons, T = data["Temperature"]
 94
 95     bmparams["ax"] = axes[1]
 96     m = Basemap(**bmparams)
 97     x, y = m(lons, lats)
 98     m.drawcoastlines(color='black', linewidth=1)
 99     m.drawparallels(circles, labels=[1, 0, 0, 0])
100     m.drawmeridians(meridians, labels=[0, 0, 0, 1])
101
102     #
103     cs = m.contourf(
104         x, y,
105         T_B - T,
106         20,
107         cmap=cm.coolwarm)
108     m.colorbar(
109         cs,
110         format=ticker.FuncFormatter(lambda x, pos: "%.1f" % x))
111     axes[1].set_title("required calories to boiler point (kcal/kg)\n[" + str(vd) + "]")
112     # -----------------------------------------------------
113     #plt.show()
114     plt.savefig("boiling_point_of_water3.png", bbox_inches="tight")
ちなみに水の比熱を調べたのは、水1度上げるのに必要なエネルギーが何かに依存して変化するんだったっけか、てのを知りたくて調べようとしたの。変わらない、でいいんだっけか。不変なら、ここでやった通り、「水1gを1℃上げるのに必要なカロリーは1cal (1kgを1℃、で1kcal)」。(1kg ≒ 1リットル、ね。)
標高が高い場所では、「100℃にはならないわ、余計にカロリー必要だわ」で踏んだり蹴ったり、の巻。
以前水の煮沸の話で国際山岳連合医療部会(UIAA MedCom)公認基準の話をちょっと紹介した。滅菌・殺菌のために必要なのは沸騰ではなく温度だけれども、沸騰でほぼ死滅させることは出来る。UIAA MedCom の「煮沸のデメリット」として「水を沸騰させるために燃料と時間を消費する」と言っているが、平地より余計にエネルギーが必要だ、ってわけ。
あ、「水温が外気温と同じ」はかなり無理がある仮定よ。例えば登山ならそんな水の運搬したら命に関わるし、平地の水道水は、おそらく浄水場の水温が保たれてるはず。水の比熱が高いから、ね。外気温の影響受けにくい。
2021-05-07追記:
紹介した basemap だが、作者である Jeff Whitaker が「basemap プロジェクト」としての保守を完全にやめ、pip でのインストールも不可能になった。自身による説明:
Deprecation Notice
Basemap is deprecated in favor of the Cartopy project. See notes in Cartopy, New Management, and EoL Announcement for more details.
リンク先をちょっと読むに、「より大きなプロジェクトに取り込まれた」ということに見える。cartopy はワタシ自身にとって完全に未知なのでまだ何も言わないけれど、余力があったらそのうち何か書くかも。

