(12)の続きではなくて、(11.5)の進化、のはなし。デクリメントしてどーする。
(11.5)で「メッシュ番号との対応がわかるとなお良いのだが」なんて書いたけど、よく考えれば、こんなん難しいわきゃねーな、と思い直し。
これ(basemap のソースツリーに含まれる examples)、なんだけど、プレインテキストで読みにくいので、全引用で pygmentize しとく:
 1 from __future__ import unicode_literals
 2 from mpl_toolkits.basemap import Basemap
 3 import numpy as np
 4 import matplotlib.pyplot as plt
 5 from matplotlib.ticker import FuncFormatter
 6
 7 # example showing how to create custom tick labels for a cylindrical
 8 # projection.
 9
10 def lat2str(deg):
11     min = 60 * (deg - np.floor(deg))
12     deg = np.floor(deg)
13     dir = 'N'
14     if deg < 0:
15         if min != 0.0:
16             deg += 1.0
17             min -= 60.0
18         dir = 'S'
19     return ("%d\N{DEGREE SIGN} %g' %s") % (np.abs(deg),np.abs(min),dir)
20
21 def lon2str(deg):
22     min = 60 * (deg - np.floor(deg))
23     deg = np.floor(deg)
24     dir = 'E'
25     if deg < 0:
26         if min != 0.0:
27             deg += 1.0
28             min -= 60.0
29         dir = 'W'
30     return ("%d\N{DEGREE SIGN} %g' %s") % (np.abs(deg),np.abs(min),dir)
31
32 # (1) use matplotlib custom tick formatter
33 #     instead of Basemap labelling methods.
34
35 # create figure.
36 fig=plt.figure()
37 # create Basemap instance (regular lat/lon projection).
38 # suppress_ticks=False allows custom axes ticks to be used
39 # Ticks are suppressed by default, so Basemap methods
40 # drawparallels and drawmeridians used to draw labelled lat/lon grid.
41 m = Basemap(llcrnrlon=-156.5,llcrnrlat=18.75,urcrnrlon=-154.5,urcrnrlat=20.5,
42             resolution='h',projection='cyl',suppress_ticks=False)
43 # draw coastlines, fill land and lake areas.
44 m.drawcoastlines()
45 m.fillcontinents(color='coral',lake_color='aqua')
46 # background color will be used for oceans.
47 m.drawmapboundary(fill_color='aqua')
48 # get axes instance.
49 ax = plt.gca()
50 # add custom ticks.
51 # This only works for projection='cyl'.
52 def xformat(x, pos=None): return lon2str(x)
53 xformatter = FuncFormatter(xformat)
54 ax.xaxis.set_major_formatter(xformatter)
55 def yformat(y, pos=None): return lat2str(y)
56 yformatter = FuncFormatter(yformat)
57 ax.yaxis.set_major_formatter(yformatter)
58 ax.fmt_xdata = lambda x: lon2str(x)
59 ax.fmt_ydata = lambda y: lat2str(y)
60 ax.grid()
61 ax.set_title('Hawaii')
62
63 # (2) use Basemap labelling methods, but pass a
64 #     custom formatting function with the 'fmt' keyword.
65
66 # create figure.
67 fig = plt.figure()
68 # create Basemap instance.
69 m = Basemap(llcrnrlon=-156.5,llcrnrlat=18.75,urcrnrlon=-154.5,urcrnrlat=20.5,
70             resolution='h',projection='cyl')
71 # draw coastlines, fill land and lake areas.
72 m.drawcoastlines()
73 m.fillcontinents(color='coral',lake_color='aqua')
74 # background color will be used for oceans.
75 m.drawmapboundary(fill_color='aqua')
76 # label meridians and parallels, passing string formatting function
77 # with 'fmt' keyword.
78 m.drawparallels(np.linspace(18,21,7),labels=[1,0,0,0],fmt=lat2str,dashes=[2,2])
79 m.drawmeridians(np.linspace(-157,-154,7),labels=[0,0,0,1],fmt=lon2str,dashes=[2,2])
80 plt.title('Hawaii')
81
82 plt.show()
つまり FuncFormatter を set_major_formatter する割と普通の方法と、drawparallels、drawmeridians に fmt を渡す方法の2つで可能だ、と言っている。
すわ、真似ぶべし:
 1 # -*- coding: utf-8 -*-
 2 import os
 3 import re
 4 import numpy as np
 5 import np_utils
 6
 7
 8 # ##################################################
 9 #
10 import datafile_tree
11
12
13 _all = np.zeros((135 * 8 * 10, 80 * 8 * 10))
14 for fn, dty, m1, m2, m3 in datafile_tree.walk("__converted"):
15     y = m1[0] * 8 * 10 + m2[0] * 10 + m3[0]
16     x = m1[1] * 8 * 10 + m2[1] * 10 + m3[1]
17     print(dty, m1, m2, m3, (y, x))
18     _all[y, x] += 2. if dty == "DEM05" else 1.
19
20 bd = np_utils.get_bound(_all, f=lambda a: a == 0.)
21 _x2lon = lambda x: x / (8 * 10.) + 100.
22 _y2lat = lambda y: y / (8 * 10.) * (2 / 3.)
23 elevs = _all[bd]
24 X = np.linspace(
25     _x2lon(bd[1].start),
26     _x2lon(bd[1].stop - 1),
27     elevs.shape[1])
28 Y = np.linspace(
29     _y2lat(bd[0].start),
30     _y2lat(bd[0].stop - 1),
31     elevs.shape[0])
32
33
34 # ##################################################
35 #
36 from mpl_toolkits.basemap import Basemap
37 import matplotlib.pyplot as plt
38 import matplotlib.cm as cm
39
40 fig, ax = plt.subplots()
41 fig.set_size_inches(16.53 * 2, 11.69 * 2)
42 m = Basemap(
43     llcrnrlon=X[0] - (X[10] - X[0]) / 2.,
44     llcrnrlat=Y[0] - (Y[10] - Y[0]) / 2.,
45     urcrnrlon=X[-1] + (X[2 * 10] - X[0]),
46     urcrnrlat=Y[-1],
47     resolution='i',
48     lat_0=(Y[0] + Y[-1]) / 2.,
49     lon_0=(X[0] + X[-1]) / 2.,
50     projection='cass')
51
52 lons, lats = np.meshgrid(X, Y)
53 x, y = m(lons, lats)
54
55 m.drawcoastlines(color='0.9', linewidth=1)
56 #m.fillcontinents(alpha=0.3)
57
58 def lon2str(deg):
59     return "%.1f\n[%d]" % (deg, deg - 100)
60
61 def lat2str(deg):
62     return "%.3f\n[%d]" % (deg, deg / (2. / 3))
63
64 circles = np.arange(10, 90, (2 / 3.))
65 m.drawparallels(circles, labels=[1, 0, 0, 0],
66                 fmt=lat2str)
67 meridians = np.arange(-180, 180, 1.)
68 m.drawmeridians(meridians, labels=[0, 0, 0, 1],
69                 fmt=lon2str)
70 #
71 m.pcolor(x, y, elevs, cmap=cm.summer)
72 plt.savefig("motterumotteru.png", bbox_inches="tight")
73 #plt.show()
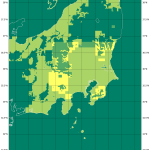
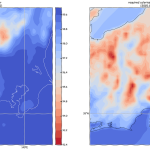
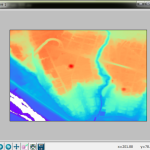
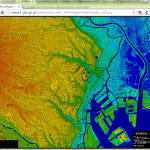
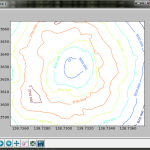
基盤地図情報数値標高モデルのメッシュ番号が、緯度方向は「北半球を135分割(1次メッシュ)・さらに8分割(2次メッシュ)・さらに10分割(3次メッシュ)」、経度方向は「経度-100(一次メッシュ)・さらに8分割(2次メッシュ)・さらに10分割(3次メッシュ)」ね、念のためおさらい。ので parallels は 2/3 ずつのステップにすると、ちょうど1次メッシュの区切りになる。
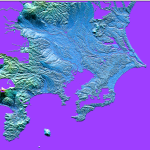
結果はこんなだよ:
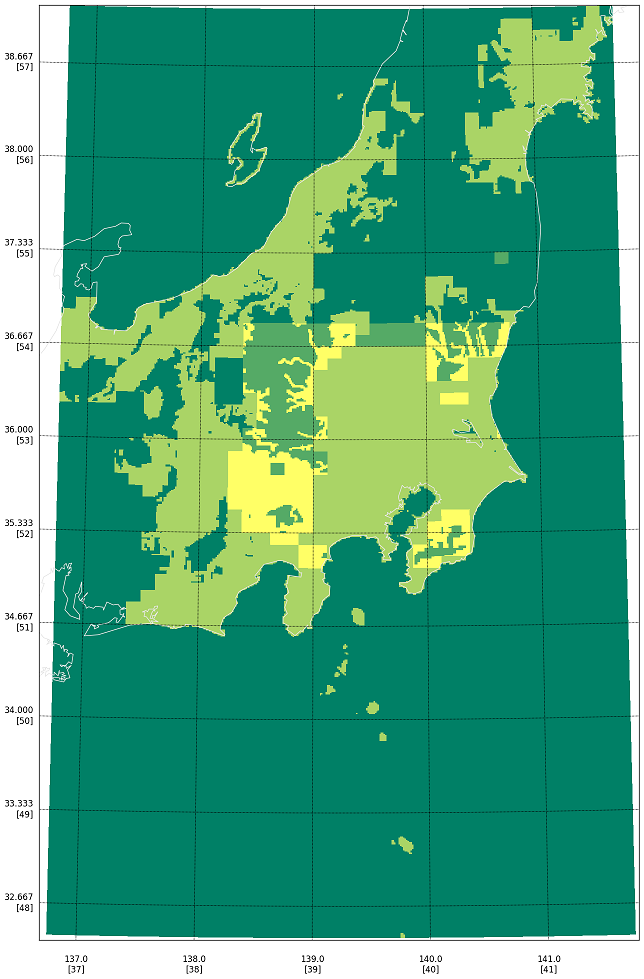
2次メッシュまでわかりやすくしても良さげではあるが…、かえって読みづらいかね?
2021-05-07追記:
紹介した basemap だが、作者である Jeff Whitaker が「basemap プロジェクト」としての保守を完全にやめ、pip でのインストールも不可能になった。自身による説明:
Deprecation Notice
Basemap is deprecated in favor of the Cartopy project. See notes in Cartopy, New Management, and EoL Announcement for more details.
リンク先をちょっと読むに、「より大きなプロジェクトに取り込まれた」ということに見える。cartopy はワタシ自身にとって完全に未知なのでまだ何も言わないけれど、余力があったらそのうち何か書くかも。