MatplotLib, pygal, curses, gnuplot…ときて…。
「見える化のためのスキルとかインフラを充実させとくとええぞ」ネタの、Windows ユーザにとってはおそらく最も依存物の少ないネタとなるだろう、これ。なんせ「入手できる」どころか、「あんた、もう持ってるぜ」だから。
自力でやろうとは思わん。検索検索:

ひとまずそのまま動かしてみるにあたり、モジュール(GoodWorkaroundCharts-v0.1.psm1)の方は掲載されてるそのままでいい、とりあえず。それを使ってるサンプルスクリプト(.ps1)の方は、以下のように書き換えた方がいい、たぶん:
 1 Import-Module .\GoodWorkaroundCharts-v0.1.psm1 -Force
 2
 3 # Create simple dataset
 4 $simpleDataset = @{
 5     "Microsoft" = 800
 6     "Apple" = 250
 7     "Google" = 400
 8     "RIM" = 0
 9 }
10
11 # Create chart and show it
12 New-Chart -Dataset $simpleDataset | Show-Chart
13
14
15
16 # Create ordered hashmap
17 $osloTemperature = [ordered]@{}
18
19 # Request weather data for Oslo, and put into dataset
20 $wc = New-Object system.Net.WebClient;
21 [xml]$weather = $wc.downloadString("http://www.yr.no/place/Norway/Oslo/Oslo/Oslo/varsel.xml")
22 $weather.weatherdata.forecast.tabular.time | foreach {
23     $osloTemperature[$_.from] = $_.temperature.value
24 }
25
26 # Create chart, add dataset and show
27 New-Chart -Title "Temperature in Oslo" -XInterval 4 -YInterval 2 -Width 1200 |
28     Add-ChartDataset -Dataset $osloTemperature -DatasetName "Temperature" -SeriesChartType Spline -OutVariable tempChart |
29     Show-Chart
30
31 # Save the chart as a PNG to the desktop
32 $tempChart.SaveImage($Env:USERPROFILE + "\Desktop\Chart.png", "PNG")
Invoke-WebRequest が Internet Explorer エンジンを使っているらしく、ワタシの今の状態だと動かんのだわ。動かす方法もワタシは知らない。system.Net.WebClient はそうではないので動く。
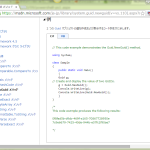
動かすとチャート2枚が順次ポップアップしたうえで、デスクトップに Chart.png をセーブする。
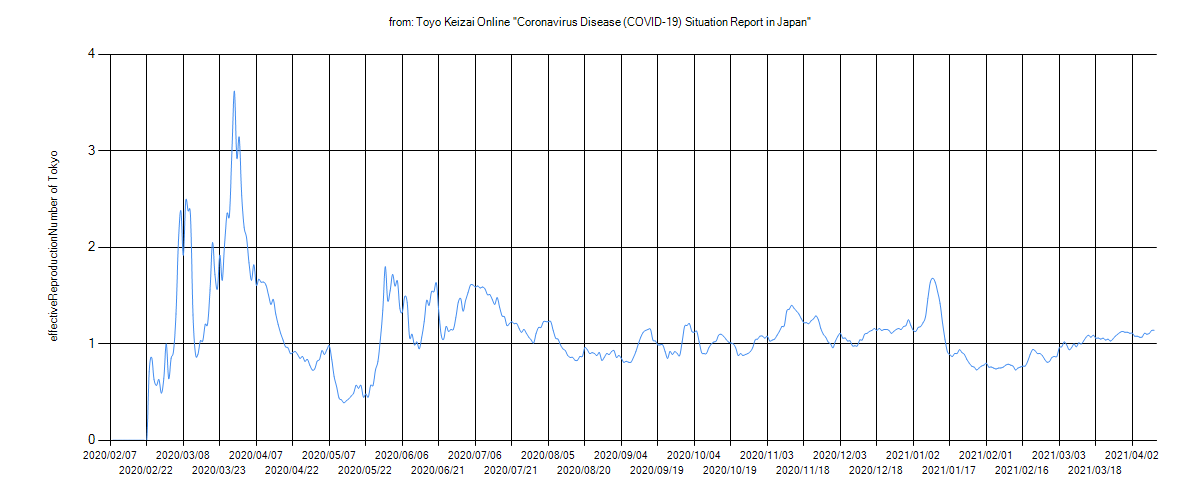
で、これの真似をして(つまり、モジュール「GoodWorkaroundCharts-v0.1.psm1」をそのまま使わせてもらうことにして):
 1 Import-Module .\GoodWorkaroundCharts-v0.1.psm1 -Force
 2
 3 $effectiveReproductionNumber = [ordered]@{}
 4 $csv = Import-Csv -path "prefectures.csv"
 5 foreach ($line in $csv)
 6 {
 7     if ($line.prefectureNameE -eq "Tokyo")
 8     {
 9         [datetime]$k = New-Object DateTime
10         [DateTime]::TryParseExact(
11             ($line.year + "-" +  $line.month + "-" +  $line.date),
12             "yyyy-M-d",
13             [System.Globalization.CultureInfo]::InvariantCulture,
14             [System.Globalization.DateTimeStyles]::None,
15             [ref]$k)
16         $effectiveReproductionNumber[$k] = $line.effectiveReproductionNumber
17     }
18 }
19 New-Chart `
20   -YTitle "effectiveReproductionNumber of Tokyo" `
21   -Title 'from: Toyo Keizai Online "Coronavirus Disease (COVID-19) Situation Report in Japan"' `
22   -XInterval 15 -YInterval 0.25 -Width 1200 |
23   Add-ChartDataset -Dataset $effectiveReproductionNumber `
24   -DatasetName "effectiveReproductionNumber" `
25   -SeriesChartType Spline `
26   -OutVariable effprodChart #| Show-Chart
27
28 $effprodChart.SaveImage("./effectiveReproductionNumber_Tokyo.png", "PNG")
あるいはダイレクトに東洋経済オンラインから csv をダウンロードするなら:
 1 Import-Module .\GoodWorkaroundCharts-v0.1.psm1 -Force
 2
 3 $effectiveReproductionNumber = [ordered]@{}
 4 $wc = New-Object system.Net.WebClient;
 5 $csv = $wc.downloadString(
 6     "https://toyokeizai.net/sp/visual/tko/covid19/csv/prefectures.csv") | ConvertFrom-Csv
 7 foreach ($line in $csv)
 8 {
 9     if ($line.prefectureNameE -eq "Tokyo")
10     {
11         [datetime]$k = New-Object DateTime
12         [DateTime]::TryParseExact(
13             ($line.year + "-" +  $line.month + "-" +  $line.date),
14             "yyyy-M-d",
15             [System.Globalization.CultureInfo]::InvariantCulture,
16             [System.Globalization.DateTimeStyles]::None,
17             [ref]$k)
18         $effectiveReproductionNumber[$k] = $line.effectiveReproductionNumber
19     }
20 }
21 New-Chart `
22   -YTitle "effectiveReproductionNumber of Tokyo" `
23   -Title 'from: Toyo Keizai Online "Coronavirus Disease (COVID-19) Situation Report in Japan"' `
24   -XInterval 15 -YInterval 0.25 -Width 1200 |
25   Add-ChartDataset -Dataset $effectiveReproductionNumber `
26   -DatasetName "effectiveReproductionNumber" `
27   -SeriesChartType Spline `
28   -OutVariable effprodChart #| Show-Chart
29
30 $effprodChart.SaveImage("./effectiveReproductionNumber_Tokyo.png", "PNG")
 1 Import-Module .\GoodWorkaroundCharts-v0.1.psm1 -Force
 2
 3 $effectiveReproductionNumber = @{}
 4 $effectiveReproductionNumber["Tokyo"] = [ordered]@{}
 5 $effectiveReproductionNumber["Osaka"] = [ordered]@{}
 6 #$wc = New-Object system.Net.WebClient;
 7 #$csv = $wc.downloadString(
 8 #    "https://toyokeizai.net/sp/visual/tko/covid19/csv/prefectures.csv") | ConvertFrom-Csv
 9 $csv = Import-Csv -path "prefectures.csv"
10 foreach ($line in $csv)
11 {
12     if (($line.prefectureNameE -eq "Osaka") -or ($line.prefectureNameE -eq "Tokyo"))
13     {
14         [datetime]$k = New-Object DateTime
15         [DateTime]::TryParseExact(
16             ($line.year + "-" +  $line.month + "-" +  $line.date),
17             "yyyy-M-d",
18             [System.Globalization.CultureInfo]::InvariantCulture,
19             [System.Globalization.DateTimeStyles]::None,
20             [ref]$k) | Out-Null
21         $effectiveReproductionNumber[$line.prefectureNameE][$k] = `
22           $line.effectiveReproductionNumber
23     }
24 }
25
26 New-Chart `
27   -YTitle "effectiveReproductionNumber (Tokyo, Osaka)" `
28   -Title 'from: Toyo Keizai Online "Coronavirus Disease (COVID-19) Situation Report in Japan"' `
29   -XInterval 15 -YInterval 0.25 -Width 1200 |
30   Add-ChartDataset -Dataset $effectiveReproductionNumber["Tokyo"] `
31   -DatasetName "Tokyo" `
32   -SeriesChartType Spline |
33   Add-ChartDataset -Dataset $effectiveReproductionNumber["Osaka"] `
34   -DatasetName "Osaka" `
35   -SeriesChartType Spline `
36   -OutVariable effprodChart | Out-Null
37
38 $effprodChart.SaveImage("./effectiveReproductionNumber_Tokyo_Osaka.png", "PNG")
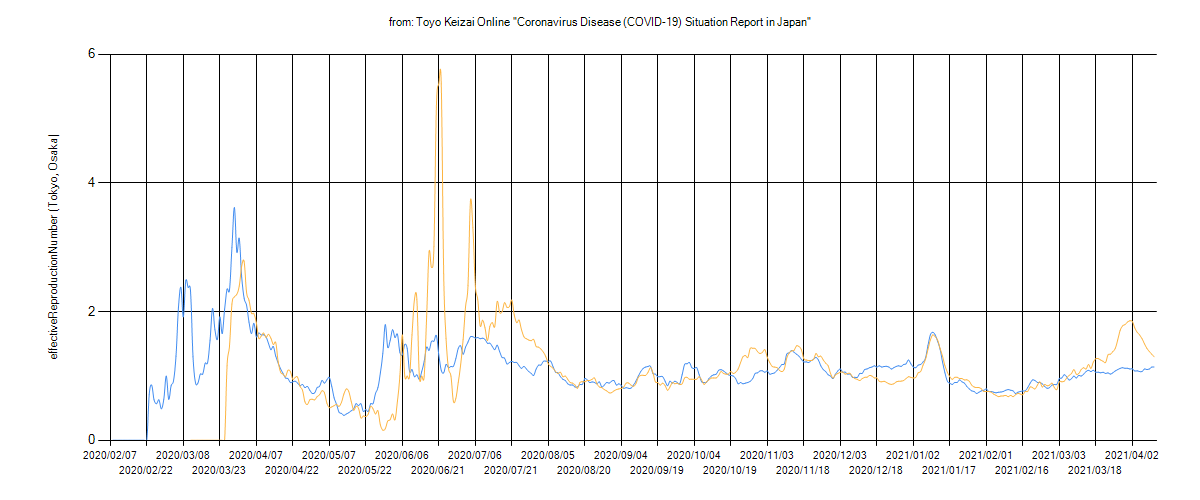
とりあえずワタシとしては「出来るよ」までは言っておいてこの先はやらない。基本的に「.net で出来ること」は全部出来るだろう。発展性はいくらでもある、が、なんせワタシが PowerShell を日常にしてないので…、「ワタシはやらない」。
2021-04-17追記:
「この先はやらない」と言ったけれど、二つだけ気になっていたことがあったので少しだけ。一つは「Lineチャート以外」、もう一つが「にほんごなんかきらいだ」問題。ふぉーえぐざんぽー:
 1 Import-Module .\GoodWorkaroundCharts-v0.1.psm1 -Force
 2
 3 $tested_positive = @{}
 4 $hospitalized = @{}
 5 $serious = @{}
 6 $death = @{}
 7 $wc = New-Object System.Net.WebClient;
 8 $wc.Encoding = [System.Text.Encoding]::UTF8
 9 $csv = $wc.downloadString(
10     "https://toyokeizai.net/sp/visual/tko/covid19/csv/demography.csv") | ConvertFrom-Csv
11 #$csv = Import-Csv -path "demography.csv" -Encoding "utf8"
12 foreach ($line in $csv)
13 {
14     #[datetime]$dt = New-Object DateTime
15     #[DateTime]::TryParseExact(
16     #    ($line.year + "-" +  $line.month + "-" +  $line.date),
17     #    "yyyy-M-d",
18     #    [System.Globalization.CultureInfo]::InvariantCulture,
19     #    [System.Globalization.DateTimeStyles]::None,
20     #    [ref]$dt) | Out-Null
21     $tested_positive[$line.age_group] = $line.tested_positive
22     $hospitalized[$line.age_group] = $line.hospitalized
23     $serious[$line.age_group] = $line.serious
24     $death[$line.age_group] = $line.death
25 }
26
27 #
28 New-Chart `
29   -YTitle "tested_positive" `
30   -Title 'from: Toyo Keizai Online "Coronavirus Disease (COVID-19) Situation Report in Japan"' `
31   -Width 1920 -Height 1080 |
32   Add-ChartDataset -Dataset $tested_positive `
33   -DatasetName "tested_positive" `
34   -SeriesChartType Pie -OutVariable tested_positive | Out-Null
35 $tested_positive.SaveImage("./demography__tested_positive.png", "PNG")
36 #
37 New-Chart `
38   -YTitle "hospitalized" `
39   -Title 'from: Toyo Keizai Online "Coronavirus Disease (COVID-19) Situation Report in Japan"' `
40   -Width 1920 -Height 1080 |
41   Add-ChartDataset -Dataset $hospitalized `
42   -DatasetName "hospitalized" `
43   -SeriesChartType Pie -OutVariable hospitalized | Out-Null
44 $hospitalized.SaveImage("./demography__hospitalized.png", "PNG")
45 #
46 New-Chart `
47   -YTitle "serious" `
48   -Title 'from: Toyo Keizai Online "Coronavirus Disease (COVID-19) Situation Report in Japan"' `
49   -Width 1920 -Height 1080 |
50   Add-ChartDataset -Dataset $serious `
51   -DatasetName "serious" `
52   -SeriesChartType Pie -OutVariable serious | Out-Null
53 $serious.SaveImage("./demography__serious.png", "PNG")
54 #
55 New-Chart `
56   -YTitle "death" `
57   -Title 'from: Toyo Keizai Online "Coronavirus Disease (COVID-19) Situation Report in Japan"' `
58   -Width 1920 -Height 1080 |
59   Add-ChartDataset -Dataset $death `
60   -DatasetName "death" `
61   -SeriesChartType Pie -OutVariable death | Out-Null
62 $death.SaveImage("./demography__death.png", "PNG")
「Lineチャート以外」について、モジュールを変える必要があるかろうと思ってたけど、思ったより格調性拡張性高く作ってあった。というか猿真似で「Spline」と自分で指定しとったやん、と、赤面。きゃーえっちぃ。「日本語なんて」については、あぁ相変わらず Microsoft よなぁ、と。なんで今どき Shift-JIS がデフォルトやねん、と。まぁ CPython もそれに倣っちゃってるんで、PowerShell だけを責めることは確かにできんけれども。ともあれ、出来上がった絵:
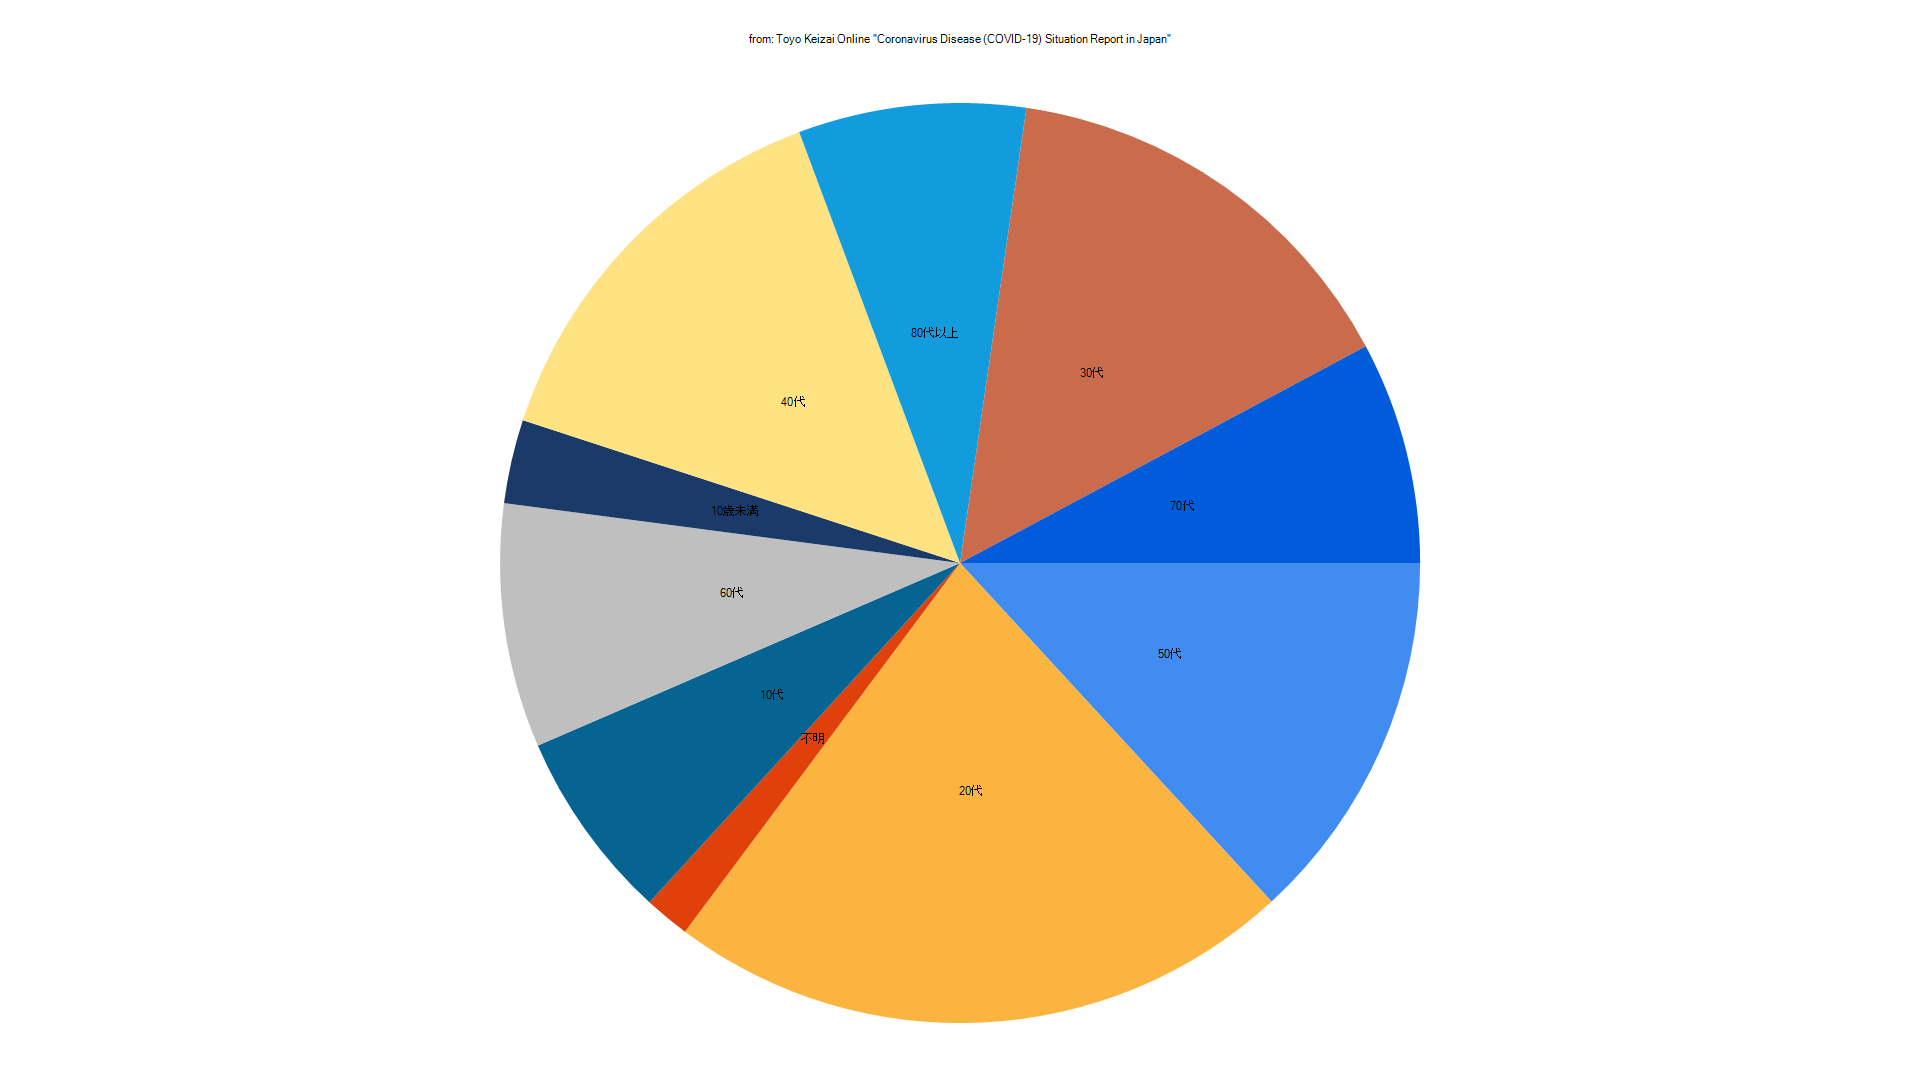
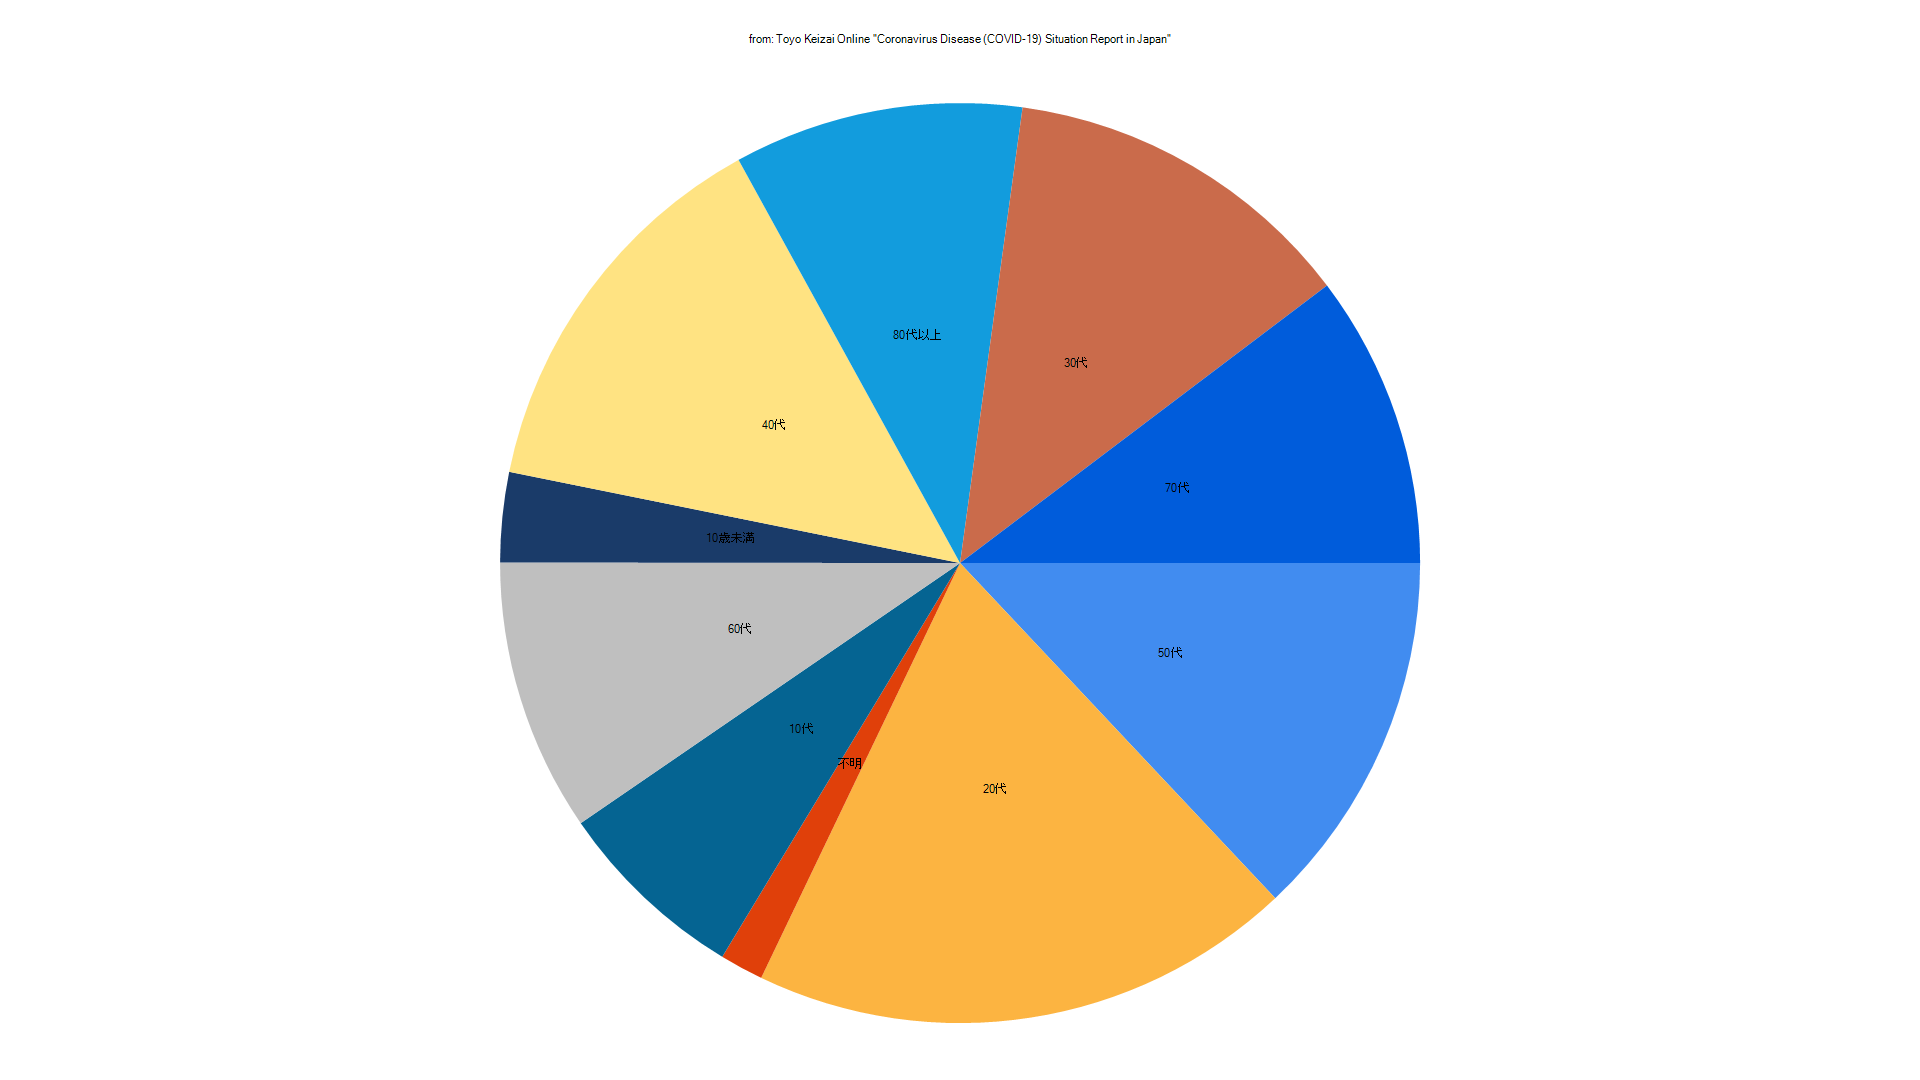
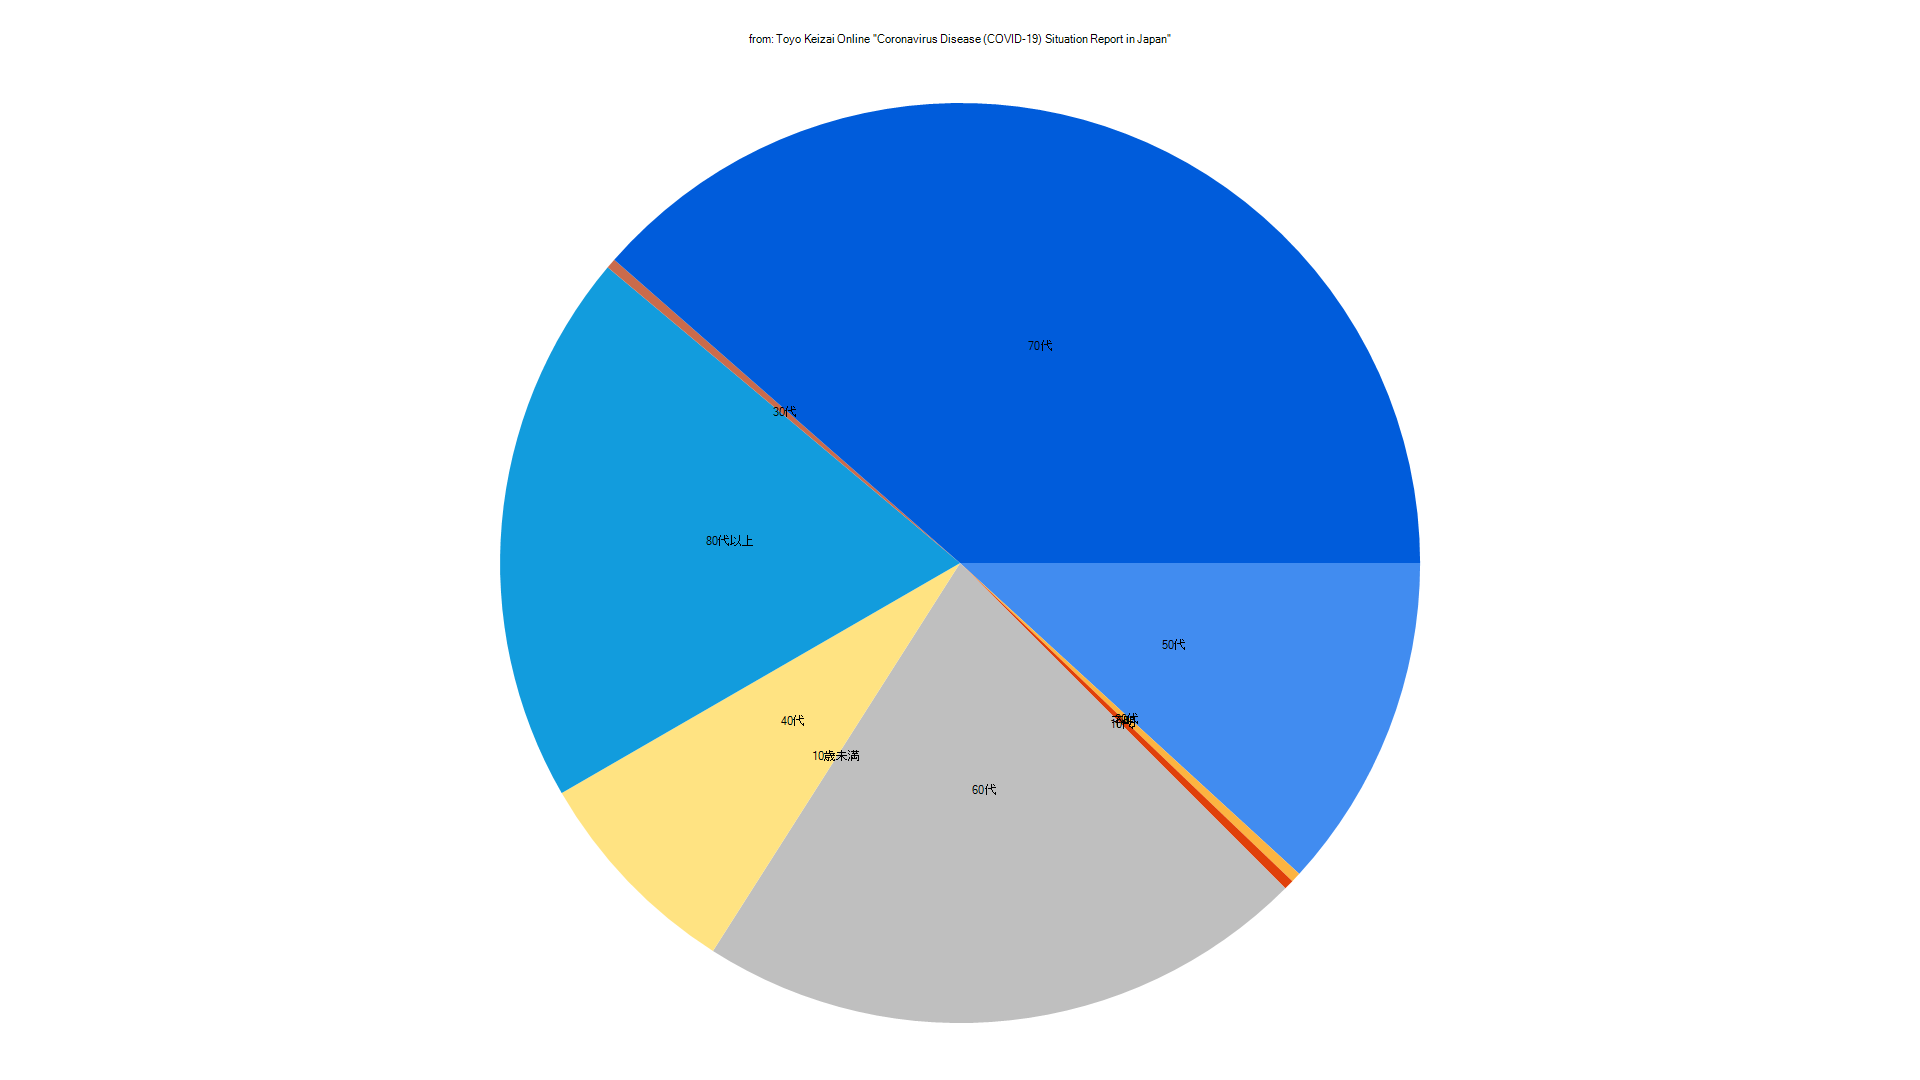
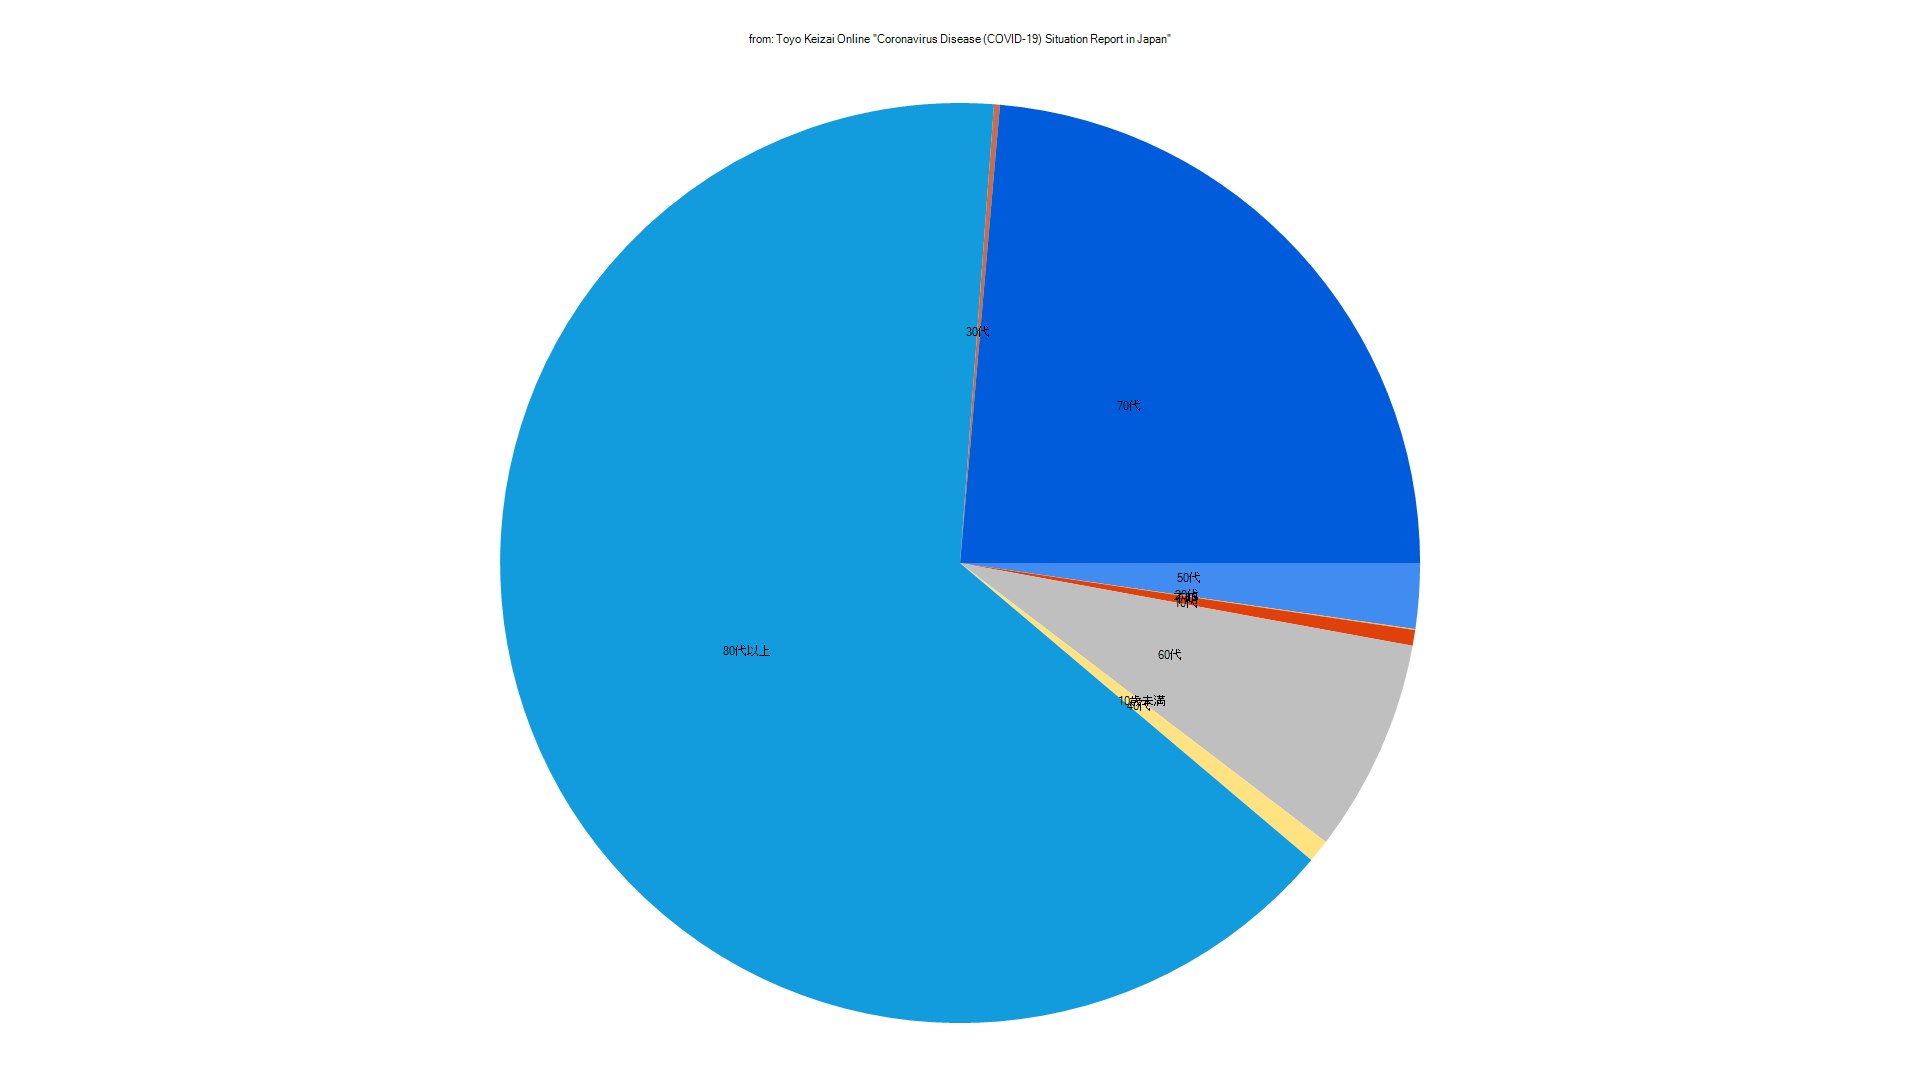
YTitle 制御が効いてない。本気用途にしたいなら、ほかの手段を講じる必要がありそうだね。
