気圧のグラフったって、大したもんを描こうってんではない。
元ネタ:
- Android Environmental sensors…
- Android センサーの TYPE_PRESSURE で少し遊ぶ
- kivyLauncher 環境でグラフ (+ kivy garden について)
ので、
android.txt– お約束environmental_sensors.py– Android Environmental sensors…geographiclib_web.py– Android センサーの TYPE_PRESSURE で少し遊ぶ 参照libs/garden/garden.graph/__init__.py– kivyLauncher 環境でグラフ (+ kivy garden について) 参照main.py– ここで扱うもの
参照
てことで。
Pressure Altitude の NOAA による計算式再掲:
\(
\displaystyle (1-(\frac{P_a}{1013.25})^{.190284})*145366.45
\)
\displaystyle (1-(\frac{P_a}{1013.25})^{.190284})*145366.45
\)
この曲線と現在気圧をグラフで見ると面白いかなと。うん、どーせ面白いのはアタシだけだ、けど知るもんか。
main.py
1 # -*- coding: utf-8 -*-
2 import math
3 from kivy.lang import Builder
4 from kivy.app import App
5 from kivy.clock import Clock, mainthread
6 from kivy.properties import StringProperty
7 from kivy.uix.boxlayout import BoxLayout
8 from plyer import gps
9 from environmental_sensors import pressureSensor
10 from geographiclib_web import query_geoid_eval
11 from kivy.garden.graph import Graph, LinePlot
12
13 kv = '''
14 <VariousAltitudeDemo>:
15 orientation: 'vertical'
16
17 RstDocument:
18 id: result
19 text: root.result
20
21 Graph:
22 id: graph_plot
23 background_color: (0.5, 0.5, 0.5, 1)
24 xlabel: 'Pressure'
25 ylabel: 'Altitude'
26 x_grid: True
27 y_grid: True
28 x_grid_label: True
29 y_grid_label: True
30 '''
31 Builder.load_string(kv)
32
33
34 def calc_pressure_altitude(P):
35 # NOAA formula (in feet)
36 # (see https://en.wikipedia.org/wiki/Pressure_altitude)
37 pres_alt = (1.0 - math.pow((P / 1013.25), 0.190284)) * 145366.45
38 pres_alt *= 0.3048 # in metre
39 return pres_alt
40
41
42 class VariousAltitudeDemo(BoxLayout):
43 result = StringProperty()
44 lon = None
45 lat = None
46 alt = None
47
48 def __init__(self):
49 super(VariousAltitudeDemo, self).__init__()
50 pressureSensor.enable()
51 gps.configure(on_location=self.on_location,
52 on_status=self.on_status)
53 gps.start()
54
55 self.graph = self.ids.graph_plot
56
57 P = pressureSensor.value
58 while not P:
59 import time
60 time.sleep(0.5)
61 P = pressureSensor.value
62 self.plot_ISA_P = LinePlot(color=[0, 0, 1, 1], line_width=2)
63 _PRNG = 5
64 self.plot_ISA_P.points = [
65 (p, calc_pressure_altitude(p))
66 for p in range(int(P) - _PRNG, int(P) + _PRNG, 1)
67 ]
68 self.graph.xmin = int(P) - _PRNG
69 self.graph.xmax = int(P) + _PRNG
70 self.graph.ymin = int(calc_pressure_altitude(P + _PRNG))
71 self.graph.ymax = int(calc_pressure_altitude(P - _PRNG))
72 self.graph.x_ticks_major = 5
73 self.graph.x_ticks_minor = 1
74 self.graph.y_ticks_major = 10
75 self.graph.y_ticks_minor = 5
76 self.plot_PA = LinePlot(color=[1, 0, 0, 1], line_width=2)
77 self.graph.add_plot(self.plot_ISA_P)
78 self.graph.add_plot(self.plot_PA)
79
80 Clock.schedule_interval(self.do_interval, 1.)
81
82 @mainthread
83 def on_location(self, **kwargs):
84 self.lon = float(kwargs['lon'])
85 self.lat = float(kwargs['lat'])
86 self.alt = float(kwargs['altitude'])
87
88 @mainthread
89 def on_status(self, stype, status):
90 pass
91
92 def do_interval(self, *args, **kwargs):
93 geoid = {}
94 if self.lon:
95 geoid = query_geoid_eval(self.lon, self.lat)
96
97 P = pressureSensor.value
98 pres_alt = calc_pressure_altitude(P)
99 plot = self.plot_PA
100 plot.points = [
101 (P, 0),
102 (P, pres_alt),
103 (0, pres_alt),
104 ]
105
106 self.result = """
107 GPS
108 ===
109 * alt: {} [m]
110
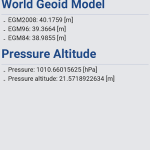
111 World Geoid Model
112 =================
113 * EGM2008: {} [m]
114 * EGM96: {} [m]
115 * EGM84: {} [m]
116
117 Pressure Altitude
118 =================
119 * Pressure: {} [hPa]
120 * Pressure altitude: {} [m]
121
122 """.format(self.alt,
123 geoid.get('EGM2008'), geoid.get('EGM96'), geoid.get('EGM84'),
124 P, pres_alt)
125
126
127 class VariousAltitudeDemoApp(App):
128 def build(self):
129 return VariousAltitudeDemo()
130
131
132 if __name__ == '__main__':
133 VariousAltitudeDemoApp().run()
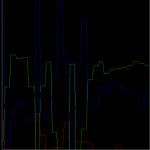
kivy.garden.graph、なんか ticks が全然言うこときいてくれなくて困った。よくある「賢すぎる」パターンで、指定を間違えると軸のラベルが表示されなかったりする。うー、バカでいいから全部表示しろや…。
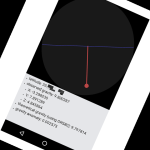
てわけでこんな:
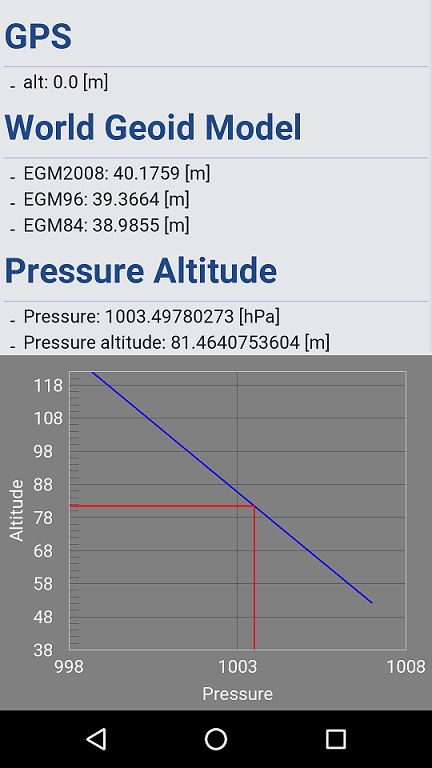
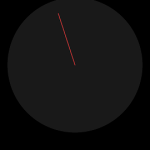
動きのないグラフで面白くはないのかもしれないけれども。ワタシには結構オモロイ。どのくらい気圧があがれば気圧高度がどのくらい変わるのかが感覚的にわかるようになるからね。
ズームとかをタップ操作でダイナミックに出来たりしたら少しはもっと面白いのであろうなぁ。