そこそこ。
大満足でもないけれど「やりたかったことの80%くらい」:
tiny_wave_wrapper については Python の wave モジュール例の殴り書き(5) を見てちょ
  1 import numpy as np
  2 import matplotlib.pyplot as plt
  3 import matplotlib.ticker as ticker
  4 from tiny_wave_wrapper import WaveReader, WaveWriter
  5
  6 _SCALES_L = ["C", "C#", "D", "D#", "E", "F", "F#", "G", "G#", "A", "A#", "B"]
  7
  8 def _nn2scale(d):
  9     return int(d / 12) - 2, _SCALES_L[int(d) % 12]
 10
 11 def _nn2freq(d):
 12     return np.power(2, (d - 69) / 12.) * 440
 13
 14 def _freq2nn(f):
 15     return 69 + 12 * np.log2(f / 440.)
 16
 17 class _nnformat(object):
 18     def __init__(self, minor):
 19         if minor:
 20             self._fmt = lambda oc, sc: "  " * (_SCALES_L.index(sc) % 2) + sc
 21         else:
 22             self._fmt = lambda oc, sc: "%s  (%d)" % (sc, oc)
 23
 24     def __call__(self, f, pos):
 25         if f > 0:
 26             nn = int(_freq2nn(f))
 27             oc, sc = _nn2scale(nn)
 28             return self._fmt(oc, sc)
 29         return ""
 30
 31 def _setup_locator(ax):
 32     _all = np.arange(24, 144)
 33     _maj = np.array([v for v in _all if v % 12 == 0])
 34     _min = np.array([v for v in _all if v % 12 != 0])
 35     ax.yaxis.set_major_locator(ticker.FixedLocator(_nn2freq(_maj)))
 36     ax.yaxis.set_minor_locator(ticker.FixedLocator(_nn2freq(_min)))
 37
 38
 39 if __name__ == '__main__':
 40     import argparse
 41     parser = argparse.ArgumentParser()
 42     parser.add_argument("mode", choices=["show", "pdf"])
 43     parser.add_argument("-s", "--step", type=int)
 44     parser.add_argument("-u", "--upper_limit_of_view", help="Hz", type=int)
 45     parser.add_argument("-l", "--lower_limit_of_view", help="Hz", type=int)
 46     parser.add_argument("-c", "--channel", choices=["both", "left", "right"])
 47     parser.add_argument("target")
 48     args = parser.parse_args()
 49
 50     with WaveReader(args.target) as fi:
 51         nchannels, width, rate, nframes, _, _ = fi.getparams()
 52         raw = np.fromstring(fi.readframes(nframes), dtype=np.int16)
 53         channels = raw[::2], raw[1::2]
 54
 55     if args.step:
 56         step = args.step
 57     else:
 58         step = rate // 8
 59     fig, ax = plt.subplots()
 60     if args.mode == "pdf":
 61         fig.set_size_inches(16.53 * 4, 11.69 * 2)
 62     for chn in range(len(channels)):
 63         if args.channel == "left":
 64             if chn == 1:
 65                 continue
 66             ax1 = ax
 67         elif args.channel == "right":
 68             if chn == 0:
 69                 continue
 70             ax1 = ax
 71         else:
 72             ax1 = plt.subplot(2, 1, chn + 1)
 73         #plt.setp(ax1.get_xticklabels(), fontsize=8)
 74         #plt.setp(ax1.get_yticklabels(), fontsize=8)
 75         #
 76         F = np.array([])
 77         channel = channels[chn]
 78         nframes = len(channel)
 79         nframes -= (nframes % step)  # drop the fraction frames
 80         for i in range(0, nframes, step):
 81             f = np.abs(np.fft.fft(channel[i:i + step]))
 82             f = f / f.max()
 83             F = np.vstack((F, f)) if len(F) else f
 84
 85         freq = np.fft.fftfreq(F.shape[1], 1./rate)
 86         X = np.arange(F.shape[0]) / (rate / step) * (2 / width)
 87         Y = freq[:len(freq) // 2]
 88         Z = F.T[:len(freq) // 2,:]
 89         if args.upper_limit_of_view:
 90             ind = (Y <= args.upper_limit_of_view)
 91             Z = Z[ind, :]
 92             Y = Y[ind]
 93         if args.lower_limit_of_view:
 94             ind = (Y >= args.lower_limit_of_view)
 95             Z = Z[ind, :]
 96             Y = Y[ind]
 97         ax1.contour(X, Y, Z, cmap='jet')
 98         ax1.set_ylabel("in Hz")
 99         _setup_locator(ax1)
100         ax1.grid(True)
101
102         ax2 = ax1.twinx()
103         #plt.setp(ax2.get_xticklabels(), fontsize=8)
104         #plt.setp(ax2.get_yticklabels(), fontsize=8)
105         ax2.contour(X, Y, Z, cmap='jet')
106         _setup_locator(ax2)
107         ax2.yaxis.set_major_formatter(ticker.FuncFormatter(_nnformat(False)))
108         ax2.yaxis.set_minor_formatter(ticker.FuncFormatter(_nnformat(True)))
109         ax2.set_ylabel("in scale")
110         ax2.grid(True)
111
112     if args.mode == "pdf":
113         plt.savefig(args.target + ".pdf", bbox_inches="tight")
114     else:
115         plt.tight_layout()
116         plt.show()
まぁ Locator を差し替えてるだけね(ここなど参照)。フォントを変えたかったが、minor tick のフォントが変わらないという事象に出くわし、仕方なくコメントアウトしてる。
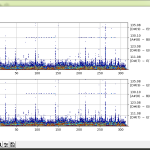
適用すればこんな:

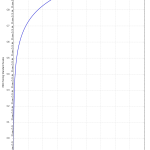
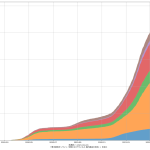
どうしても tick が詰まって読みづらいわけなんだけれど、それが理由で「log2 スケール的なこと」を、実はやるだけやってみた。カスタムスケールの公式サンプルがあるので、結構簡単に出来る。けどそっちはそっちで読みにくかった。contour との相性の問題も大きいかな。
根本的に contour は「代替策」として使っているだけで、本当は pcolor のような「素のままのデータを見る」ものの方がいいんだけれど、そうするとデータ Z を作るのが大変になっちゃう。contour は名前通り contour を引くので、log2 スケールの値が小さい部分(グラフの下の方)で「仕方なく contour」のダメな部分が「拡大」されてみえちゃうのね。ということもあるし、あと可変スケールは読み手が誤解しやすい、てのもあるしな。
まだ Locator を差し替えただけの今回の版のほうが、「ビューワの拡縮を駆使すれば使える」ことに頼ればいいだけなので、シンプルでいいかなぁ、と思った。